
View reporting
≈ 2 min read
The reporting shows you at a glance how Claritalk is being used in your organization. This way you can track adoption and quickly see where conversations are not being processed properly.
How to view the reporting
- Open Reporting
Click Reporting in the menu on the left. By default you see the figures for the entire organization for this month.
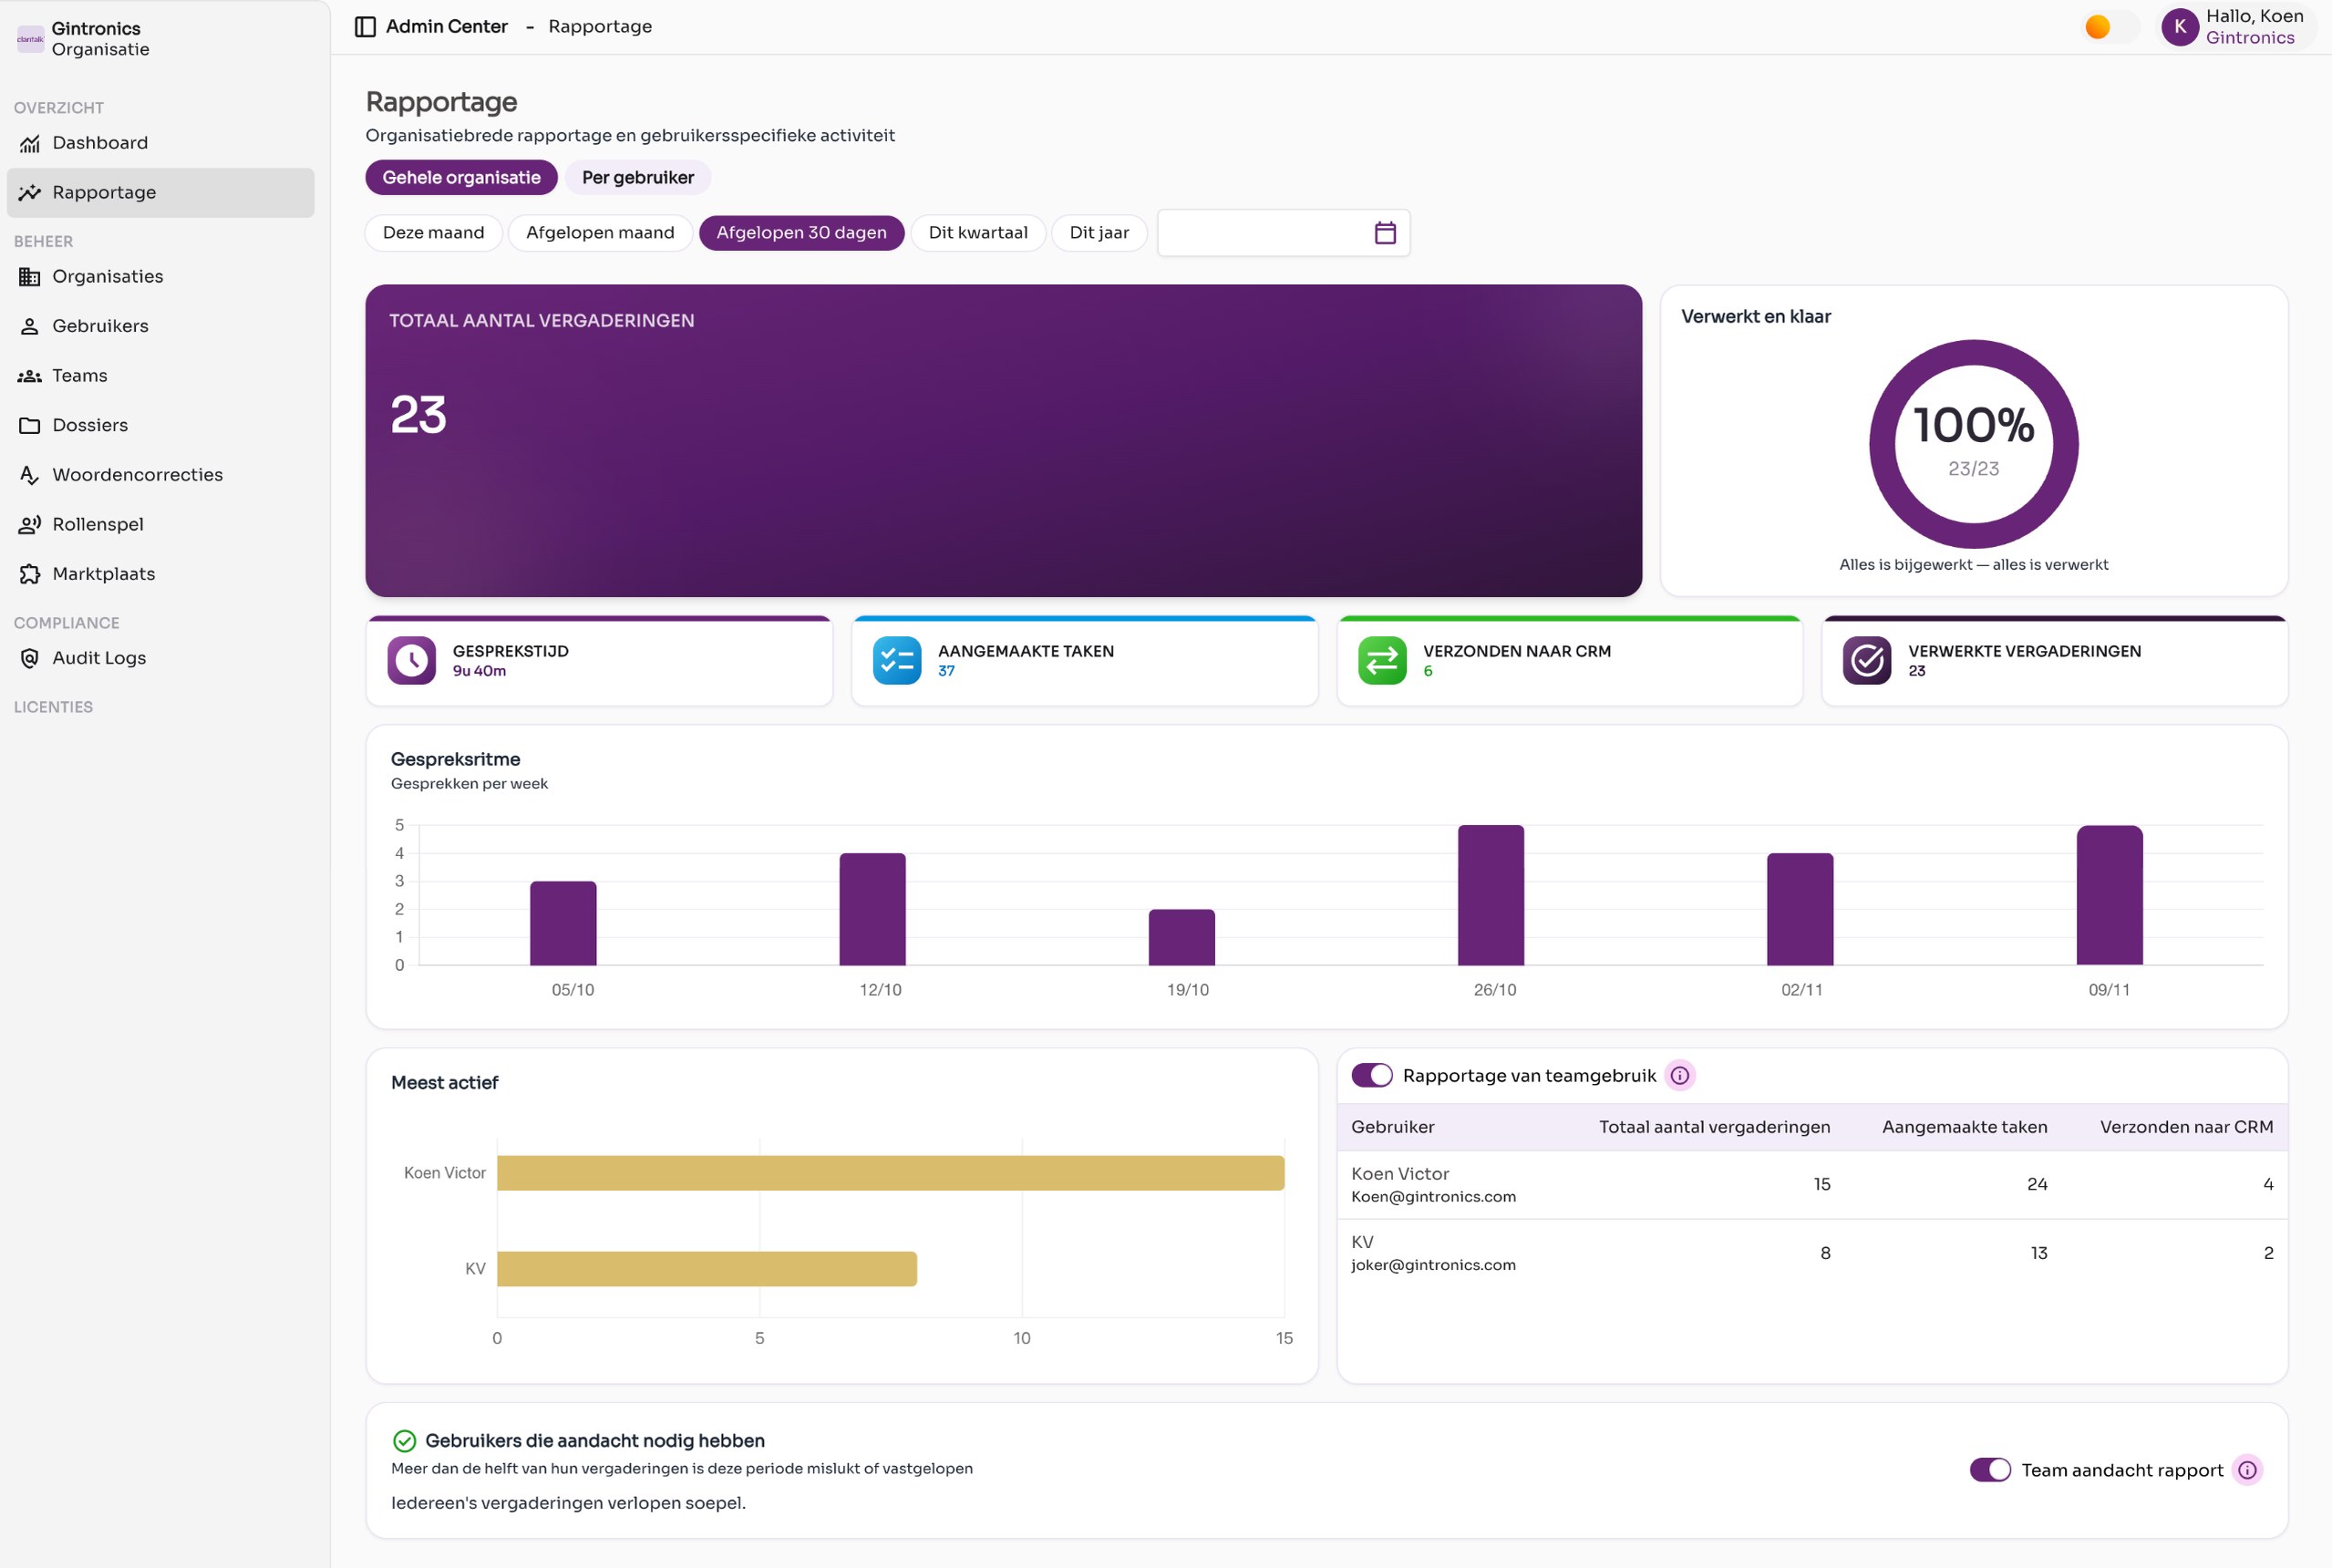
The reporting for the entire organization, period Last 30 days. - Choose a period
At the top you choose a fixed period: This month, Last month, Last 30 days, This quarter or This year. If you want a custom period, click the calendar icon on the right and select a start and end date.
- Switch to one user
Click Per user and choose a user from the Select a user dropdown list. All figures will then be shown for that one person.
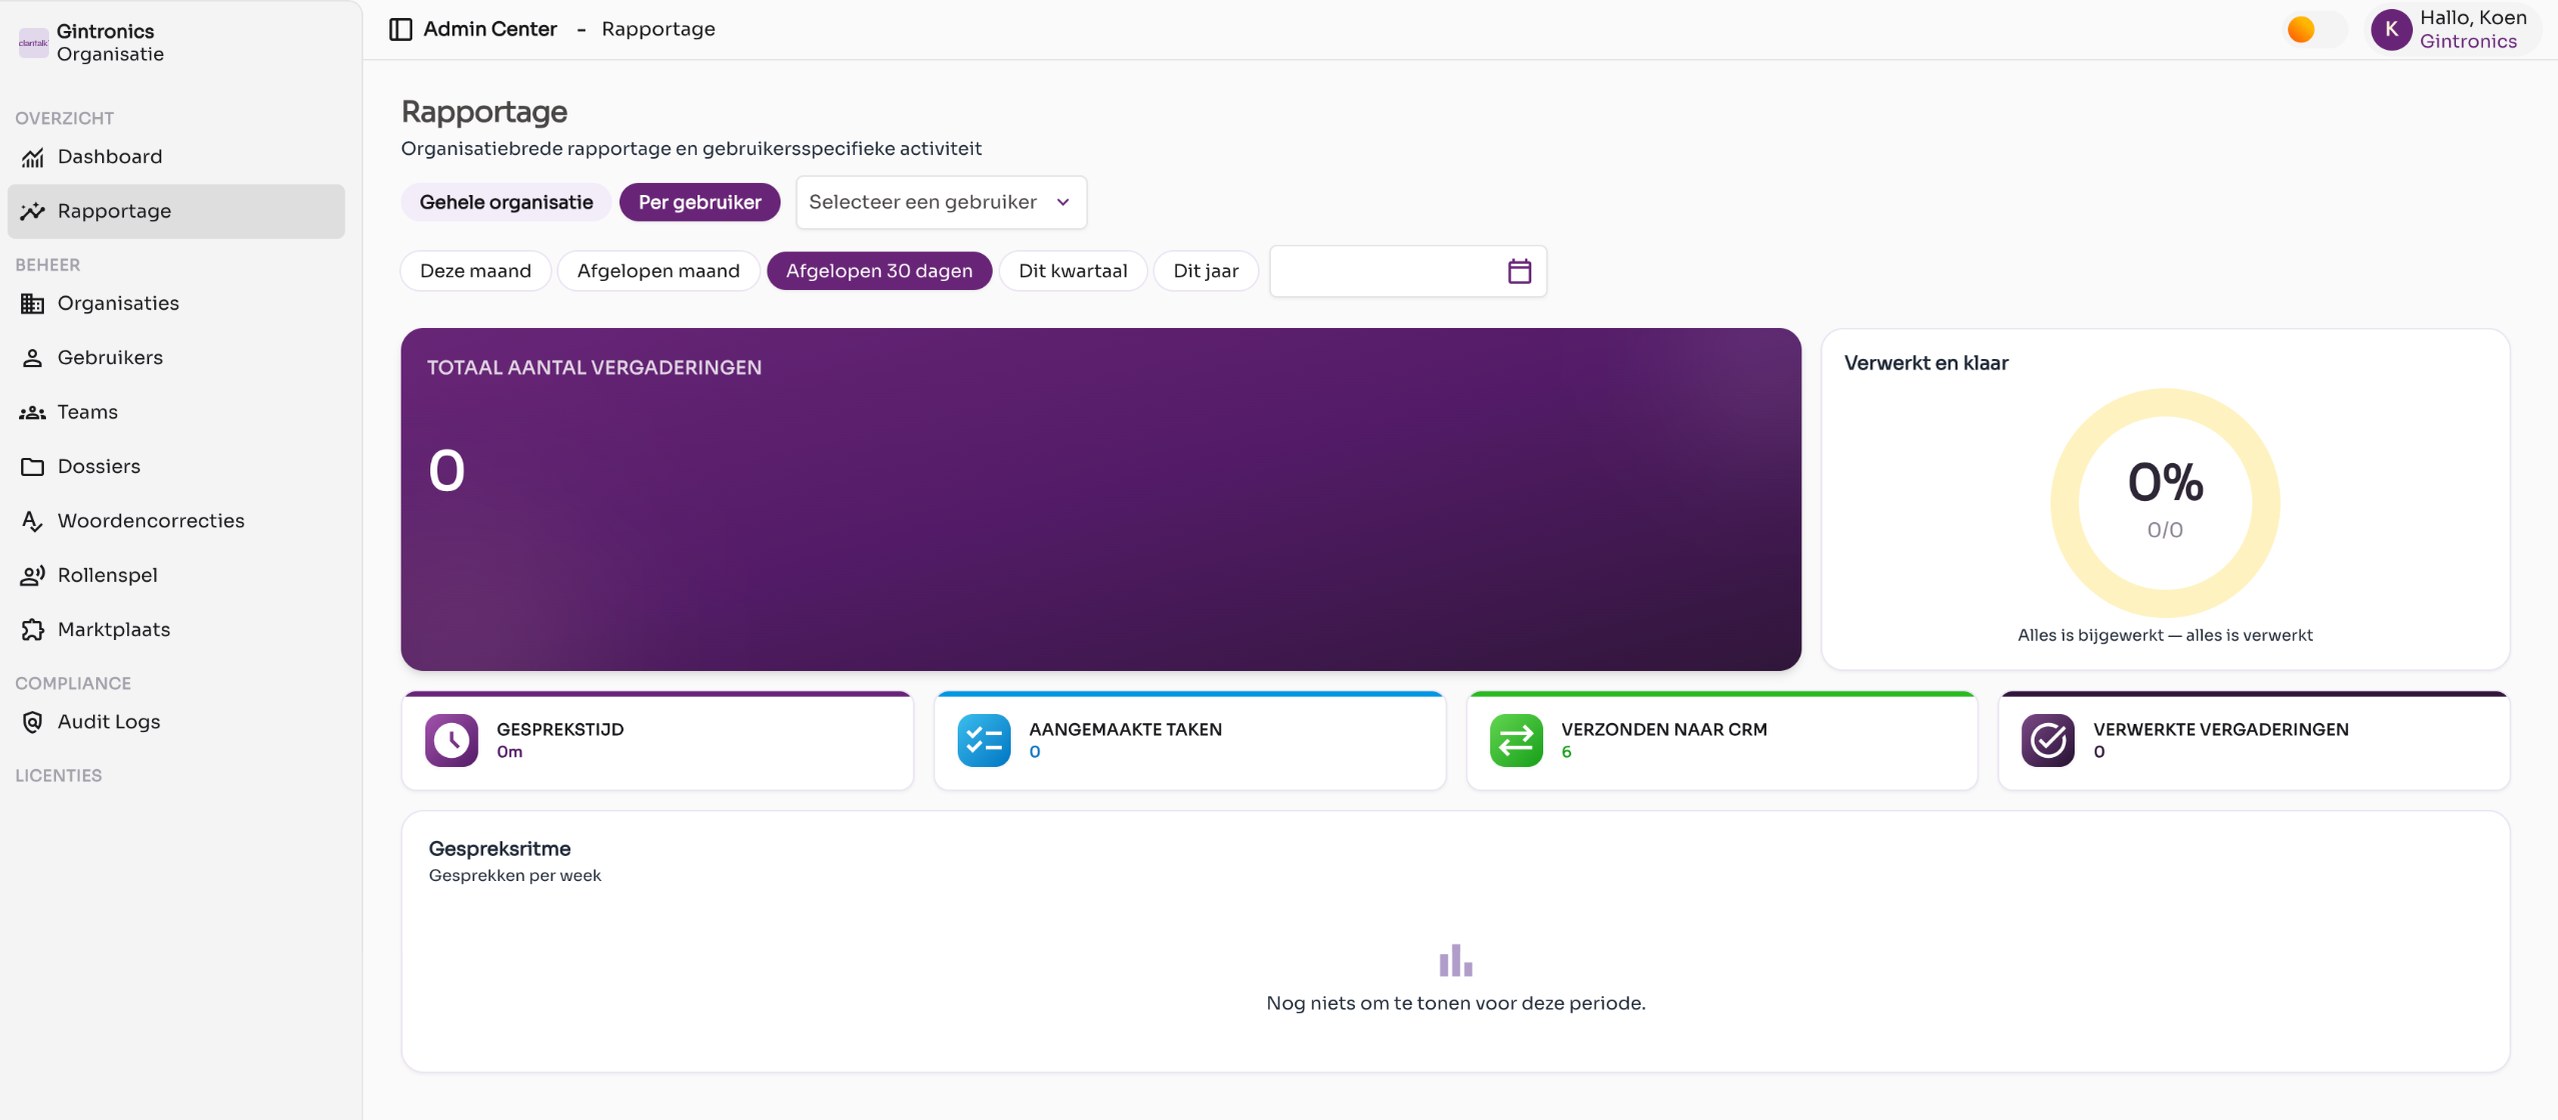
The per user view, before a user has been selected.
What the figures mean
| Item | Meaning |
|---|---|
| Total number of meetings | The number of conversations recorded in the selected period. |
| Processed and ready | The percentage of those conversations for which the transcript was successfully created. |
| Conversation time | The total recorded conversation time. |
| Created tasks | The number of tasks derived from the conversations. |
| Sent to CRM | The number of conversations that were forwarded to a linked integration. |
| Processed meetings | The number of conversations with a completed transcript. |
| Conversation rhythm | The number of conversations per week, as a bar chart. |
| Most active | The users with the highest number of conversations. |
| Team usage reporting | A table per user with meetings, tasks and CRM submissions. Turn off the toggle to hide the table. |
| Users who need attention | Users where more than half of the conversations in this period have failed or stalled. Use Team attention report to turn this block on or off. |
Good to know
Is a user listed in the Users who need attention block? Then usually something is wrong with the microphone or audio settings. Refer to the article My conversation could not be processed in the Troubleshooting section.
- The reporting only counts conversations that were started in the selected period.
- The figures are only visible to organization administrators.